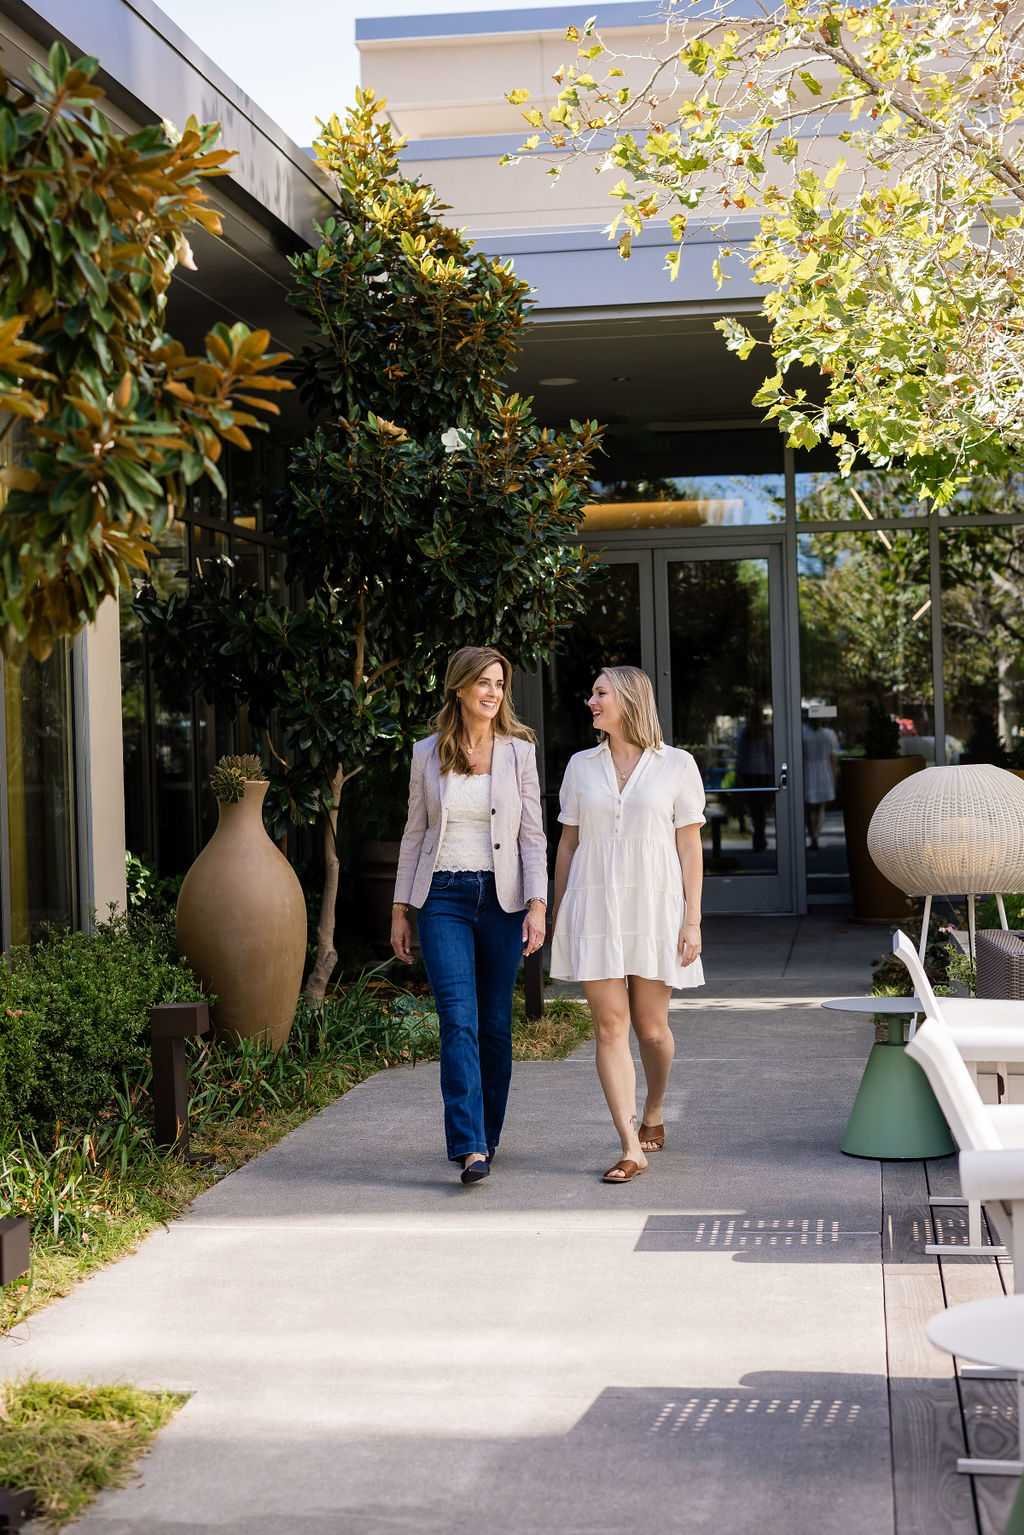
Lori Buecheler

San Mateo County

Compass

San Mateo County Real Estate, July 2021 Report

Chart of San Mateo County median house price changes, 2000–2021 YTD, highlighting the 2008 crash and 2021 increase.

Chart comparing 2021 year-to-date median house sale price increases by Bay Area county.

Chart of San Mateo County quarterly median home prices, rising above $2 million in Q2 2021.

Bar chart of San Mateo County home values per square foot, rising to $1,200 in Q2 2021.

Chart of San Mateo County condo prices by quarter, showing a rebound to $875,000 in Q2 2021.

San Mateo County home sales by price segment over six months through June 2021.

Bar chart of San Mateo County luxury home sales, with quarterly counts from 2017 to 2021 and a peak of 346 in Q2 2021.

San Mateo County luxury home sales infographic with city-by-city bars divided into four price ranges.

San Mateo County monthly new listings chart, December 2018 to June 2021, with seasonal peaks and a pandemic-era dip.

San Mateo County active listings bar chart, January 2018–June 2021, peaking in fall 2020.

San Mateo County monthly listings accepting offers, January 2018–June 2021, with seasonal trends and the pandemic marked.

Chart of San Mateo County monthly home sales, January 2019 to June 2021, with seasonal peaks and a pandemic-era dip.

San Mateo County chart of listings accepting offers by quarter, 2017–2021, with pandemic marker.

San Mateo County average days on market by quarter, Q2 2017–Q2 2021; Q2 2021 shows 19 days.

San Mateo County chart of monthly sale prices versus asking prices, with overbidding above 100% highlighted.

Comparative Review of City & Town Markets

Chart of spring 2021 house sales by San Mateo County city, led by San Mateo with 230 sales.

Chart of spring 2021 median house sale prices in San Mateo County cities, ranging from $1.025 million to $8.275 million.

Bar chart comparing median home sizes across 20 San Mateo County communities in spring 2021.

Chart of spring 2021 median home sale prices per square foot across San Mateo County cities.

San Mateo County spring 2021 overbidding chart, led by Daly City at 15%, with city percentages and market notes.

Bar chart of San Mateo County homes accepting offers within 30 days, led by Foster City at 97%.

Chart of San Mateo County employment from 2000 to May 2021, showing the sharp April 2020 drop and subsequent recovery.

Real estate market report disclaimer describing statistics, pricing measures, data limitations, and Compass terms.

Work With Lori

With over 30 years in sales, marketing, and client service, my clients describe me as "the Realtor who goes above and beyond” when it comes to market knowledge, integrity, service level and results.
Let's Connect
Follow Lori on Instagram