Lori Buecheler

Market Update

San Mateo County

June 2026 San Mateo County House & Condo Markets
Market Outlook

Data through May 2026

June 2026
Housing Market Report

Select macro-economic and demographic data for the country and the Bay Area – June 2026

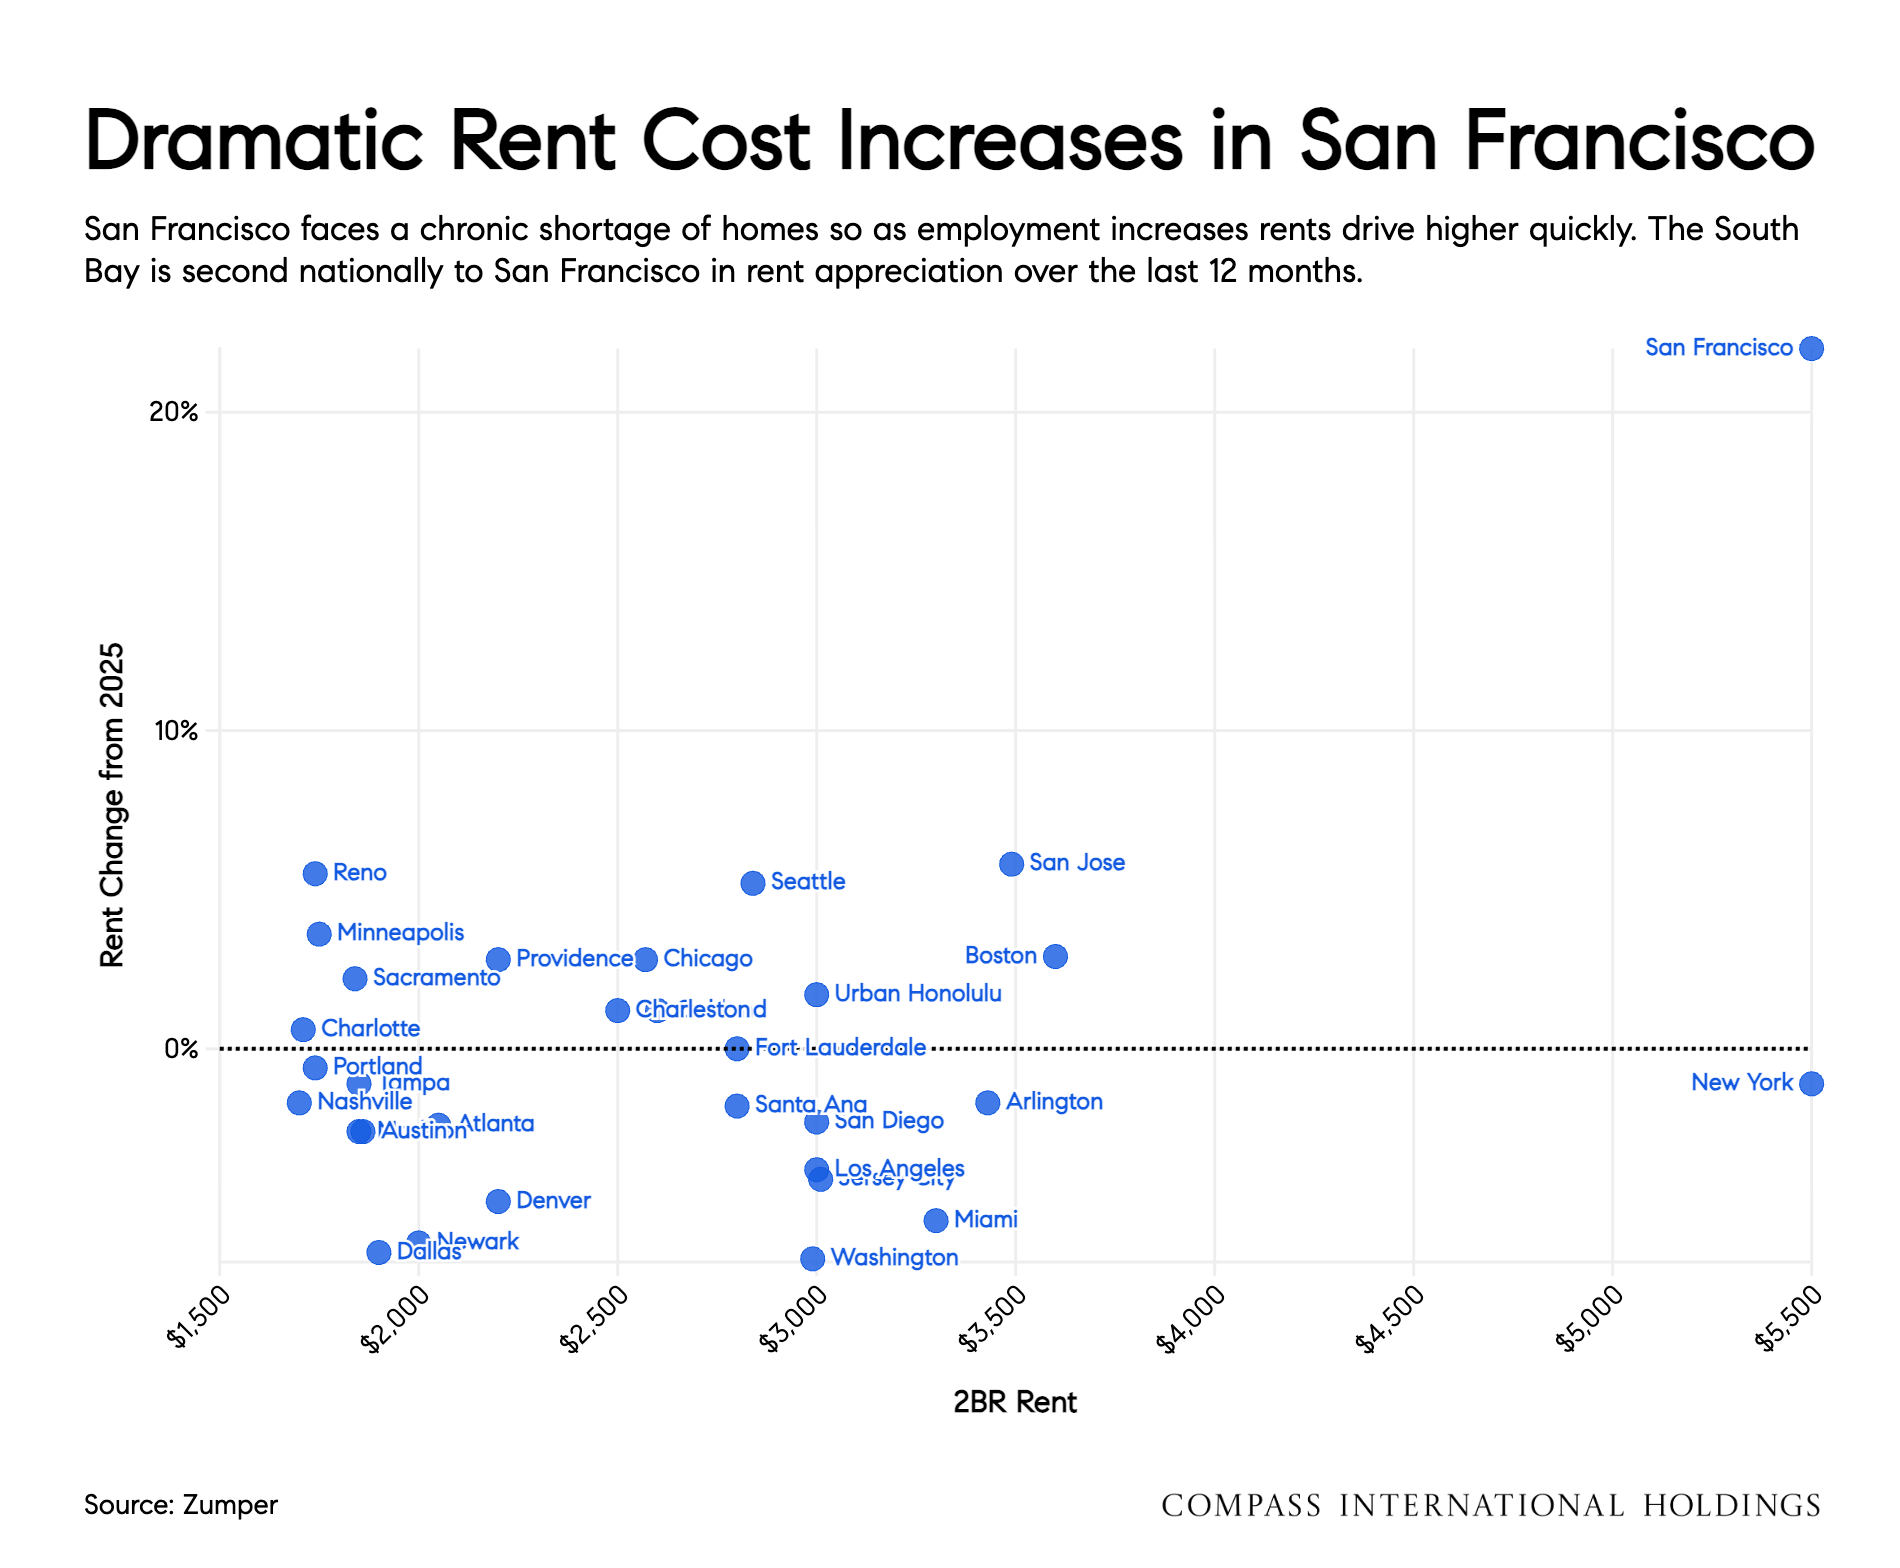
The Bay Area housing market hit a lot of national headlines in May. In San Francisco, AI and tech-driven demand has created aggressive bidding wars on the scarce inventory. Skyrocketing rents are back in the norm. Even the city’s condo market, which has been under pressure for six years, is showing signs of demand recovery.

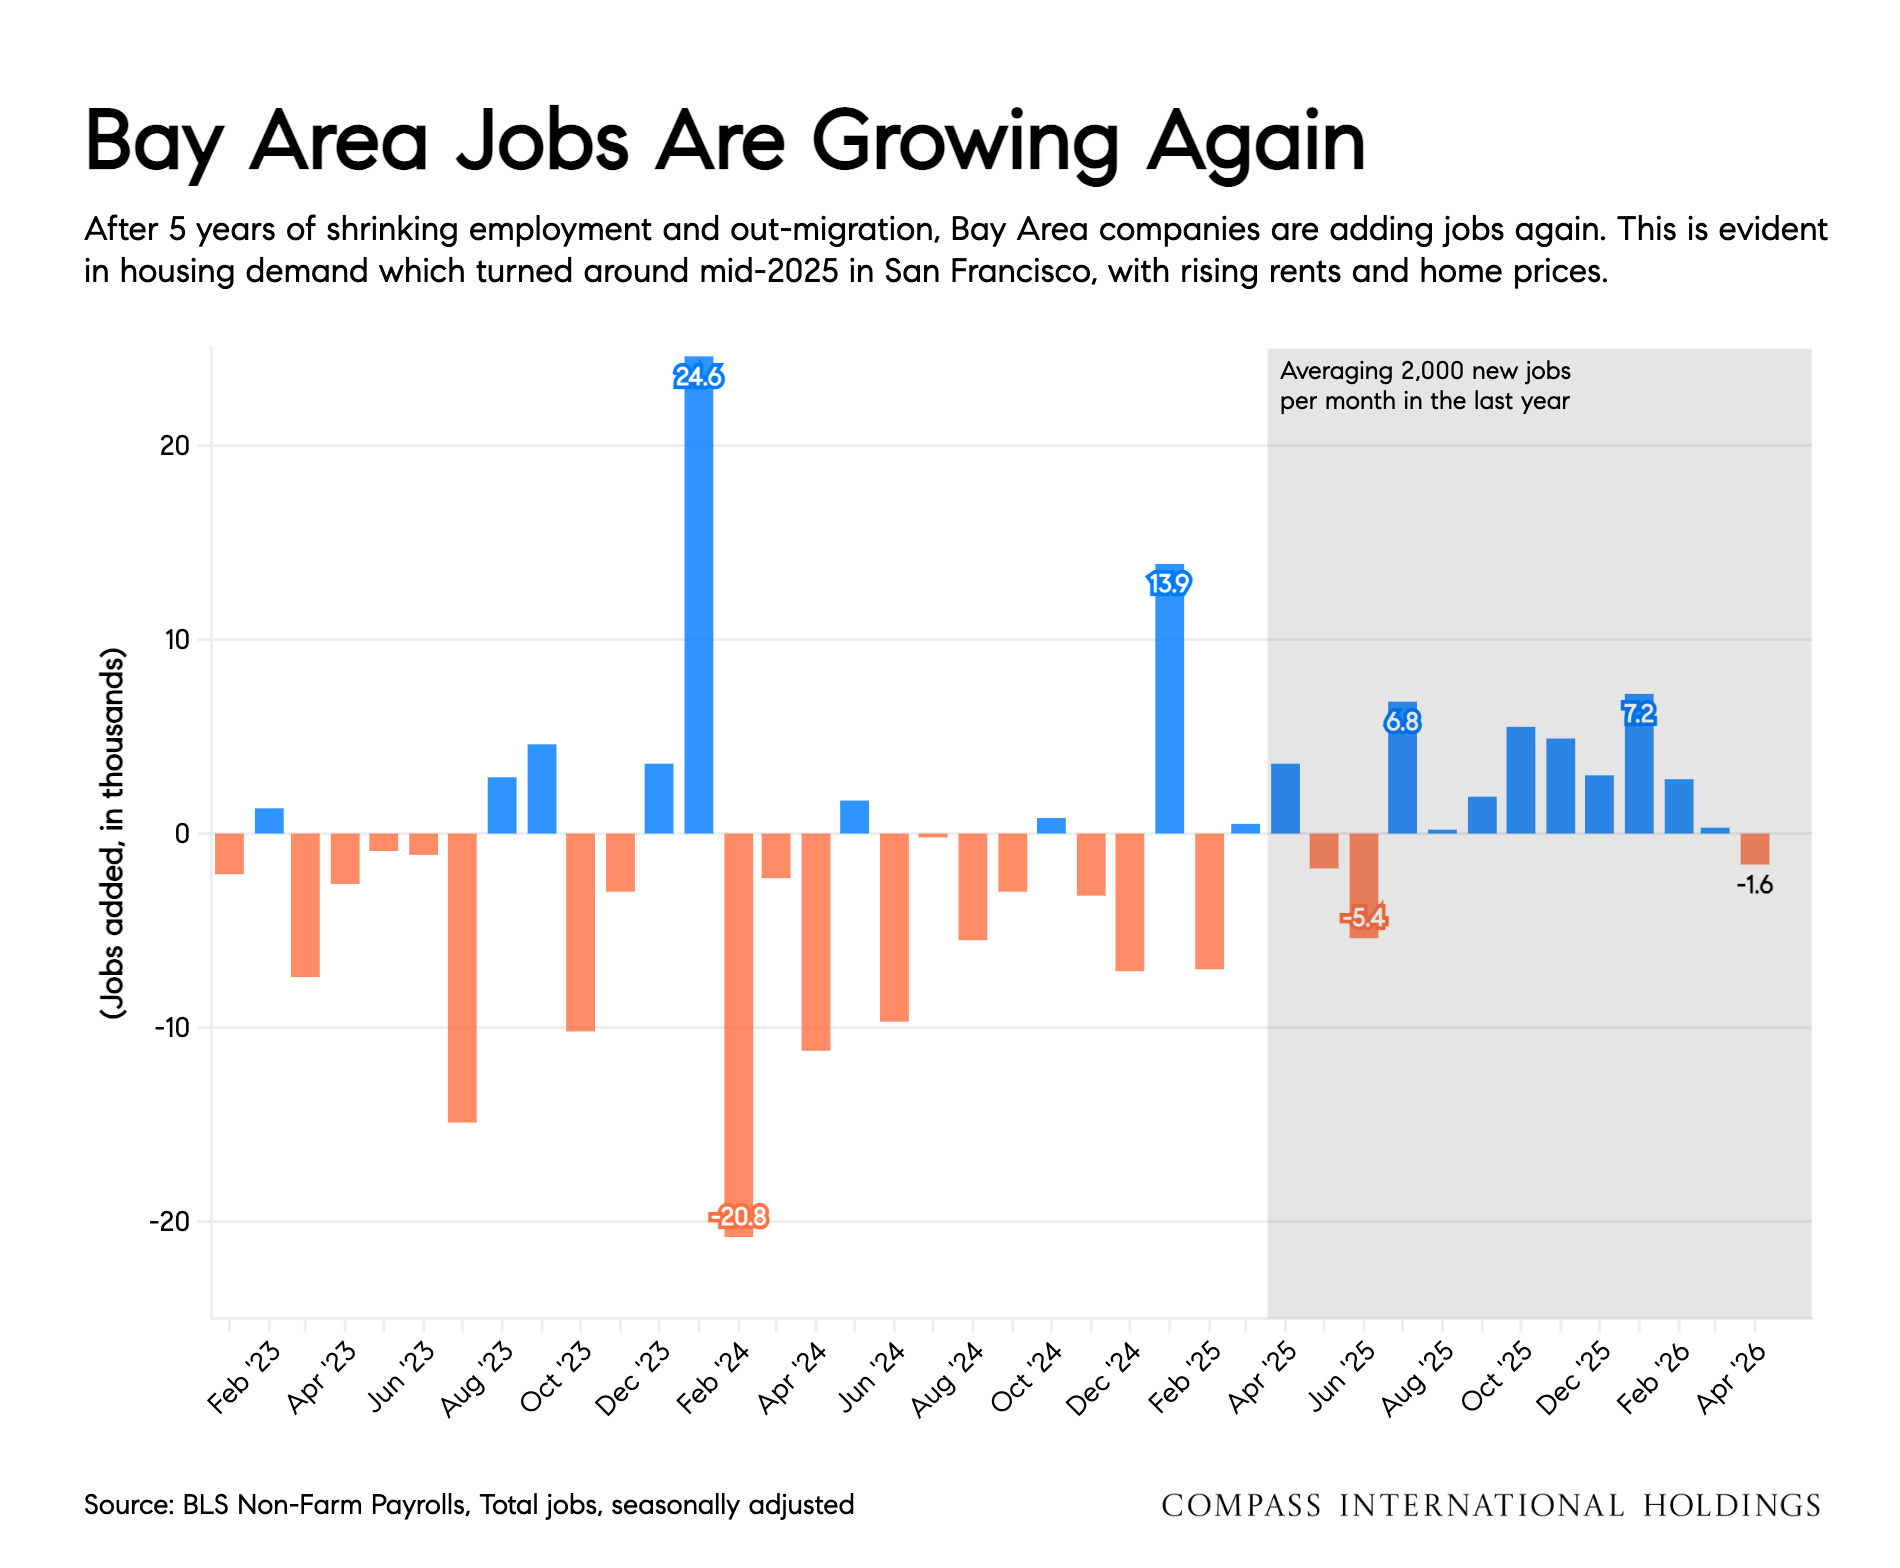
For the first time in many years job creation in the Bay Area is positive and economic opportunity is attracting net inbound migration, despite the region’s chronic shortage of homes and affordability issues. It’s notable that other tech cities like Seattle and Austin are not seeing the boom in the real estate market related to AI. In fact, those cities are now sending more people to San Francisco than the reverse.

While the city dominates the headlines, many areas have not seen the massive wealth effect driving home buying demand like the city has. In this cycle, this resurgent demand is so far concentrated to a very small section in the city, and luxury markets in Peninsula and Marin.

For much of the region, interest rates matter more than stock market performance. In May, mortgage rates jumped higher with sharply higher inflation data. That tension between higher interest rates and the wealth effect is likely to continue for the rest of 2026. Inflation pressures have been pushing higher, and it seems unlikely that interest rates will dip again very soon.

Mike Simonsen
Chief Economist
Compass International Holdings
Mortgage rate chart from April 2023 to June 2026, ending at 6.6% after a low of 5.99%.
Chart comparing two-bedroom rents and rent changes across U.S. cities, with San Francisco highest in rent growth.
Chart comparing San Francisco and national CPI from 2016 to 2026, with both ending near 3.8%.
Bar chart of monthly U.S. job gains and losses from January 2023 to May 2026, with a 2026 monthly average of 114,000.
Bar chart of Bay Area monthly job changes, with gains averaging 2,000 jobs per month in the last year.
Chart of S&P daily change from January 2025 to June 2026, surging to a new high in May 2026.
Chart of 2025 Bay Area household migration, with Seattle leading inbound moves and Seattle and Reno leading outbound moves.
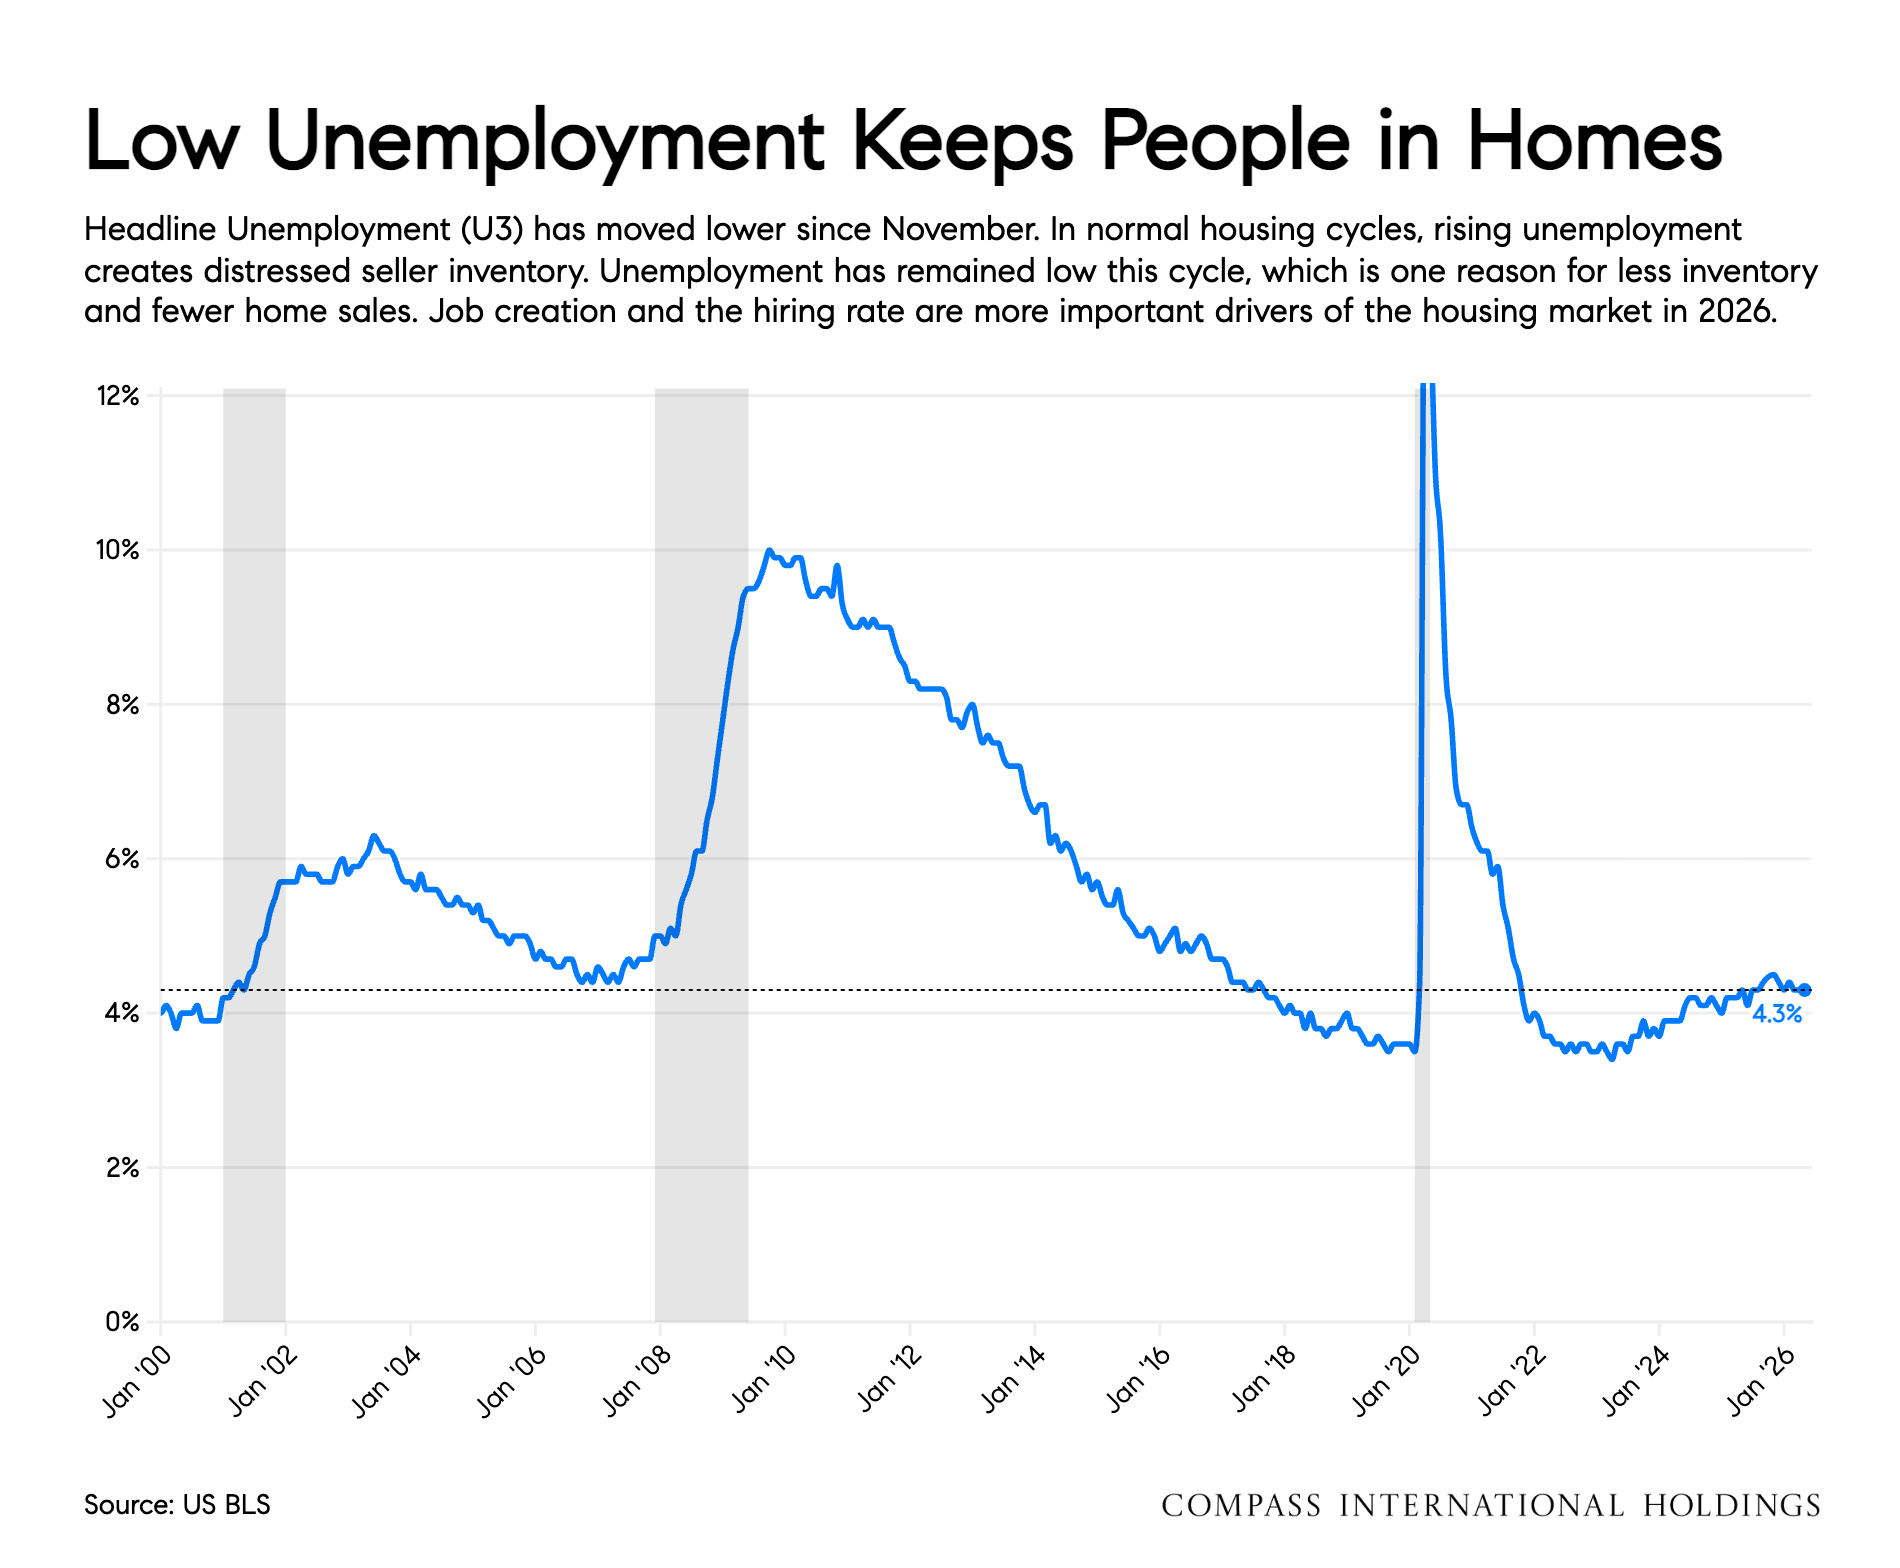
Chart of U.S. unemployment from 2000 to 2026, ending at 4.3% after sharp peaks in 2009 and 2020.
Bar chart of quarterly foreclosures, peaking at 566.2K in 2009 and reaching 59.2K in 2026.
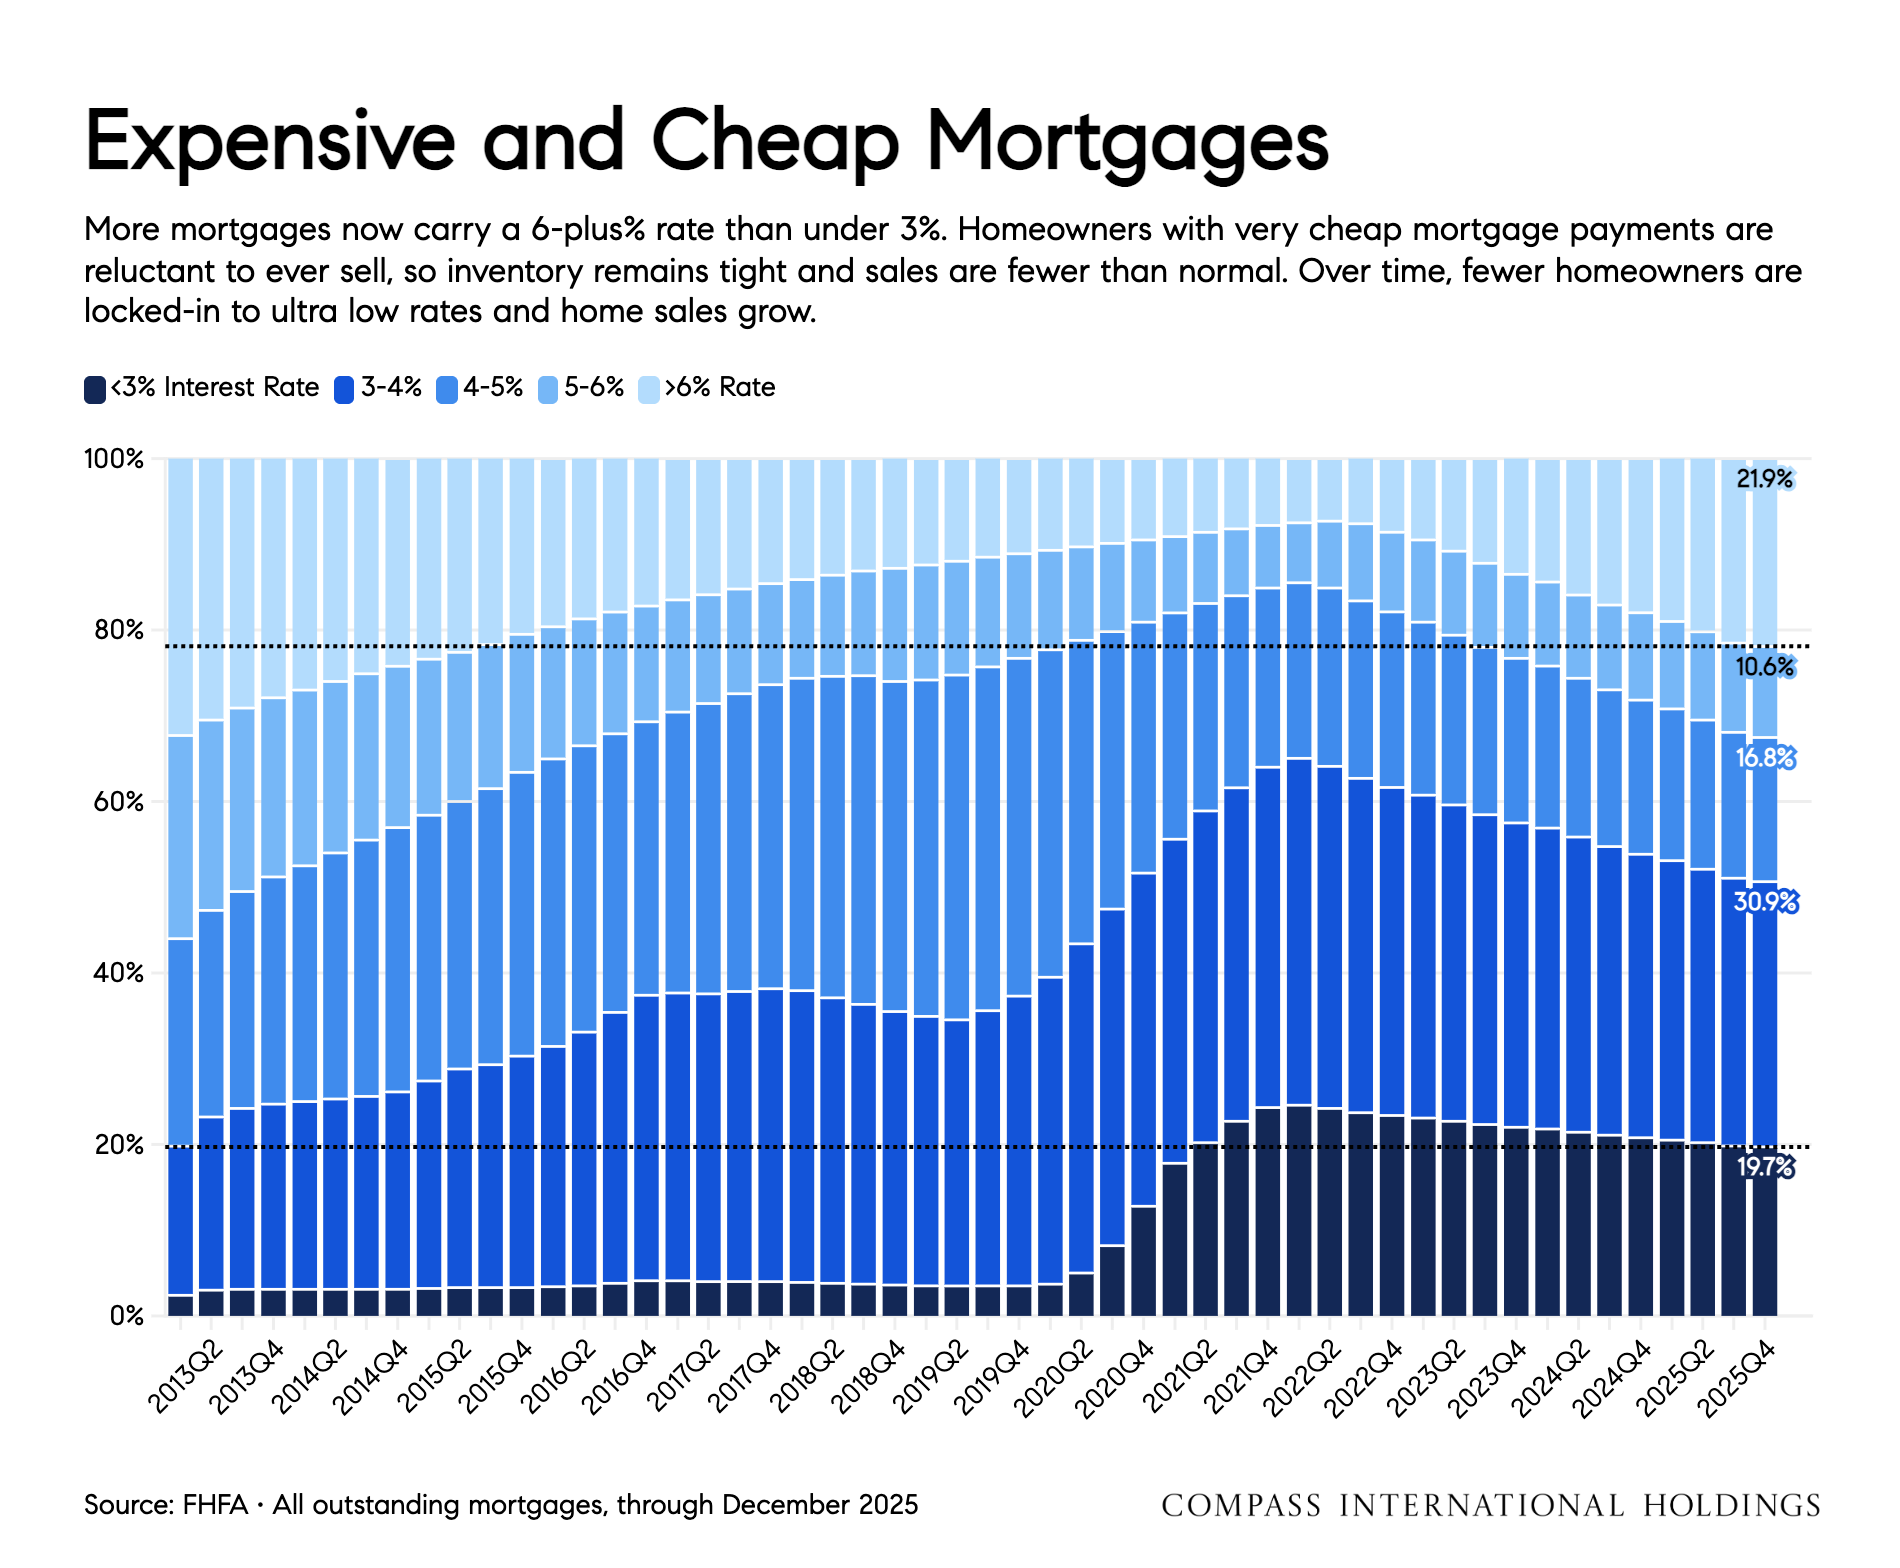
Chart of outstanding mortgage interest rates by rate range, from 2013 Q2 to 2025 Q4.
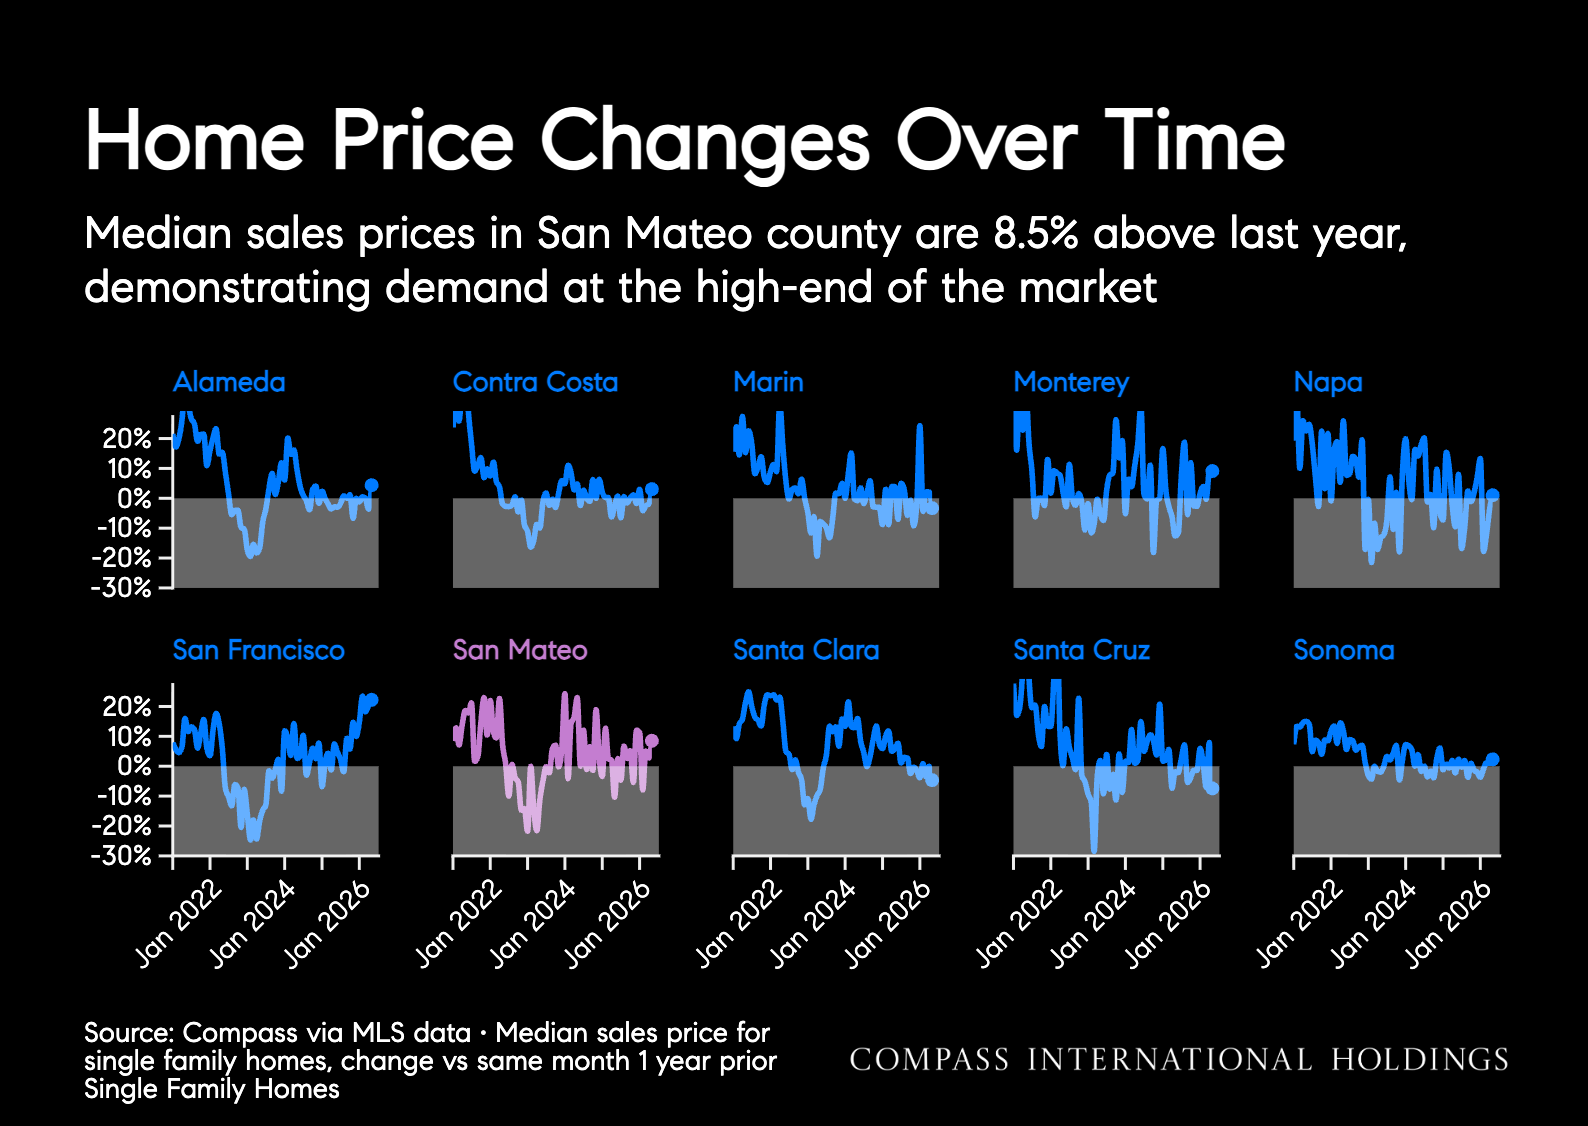
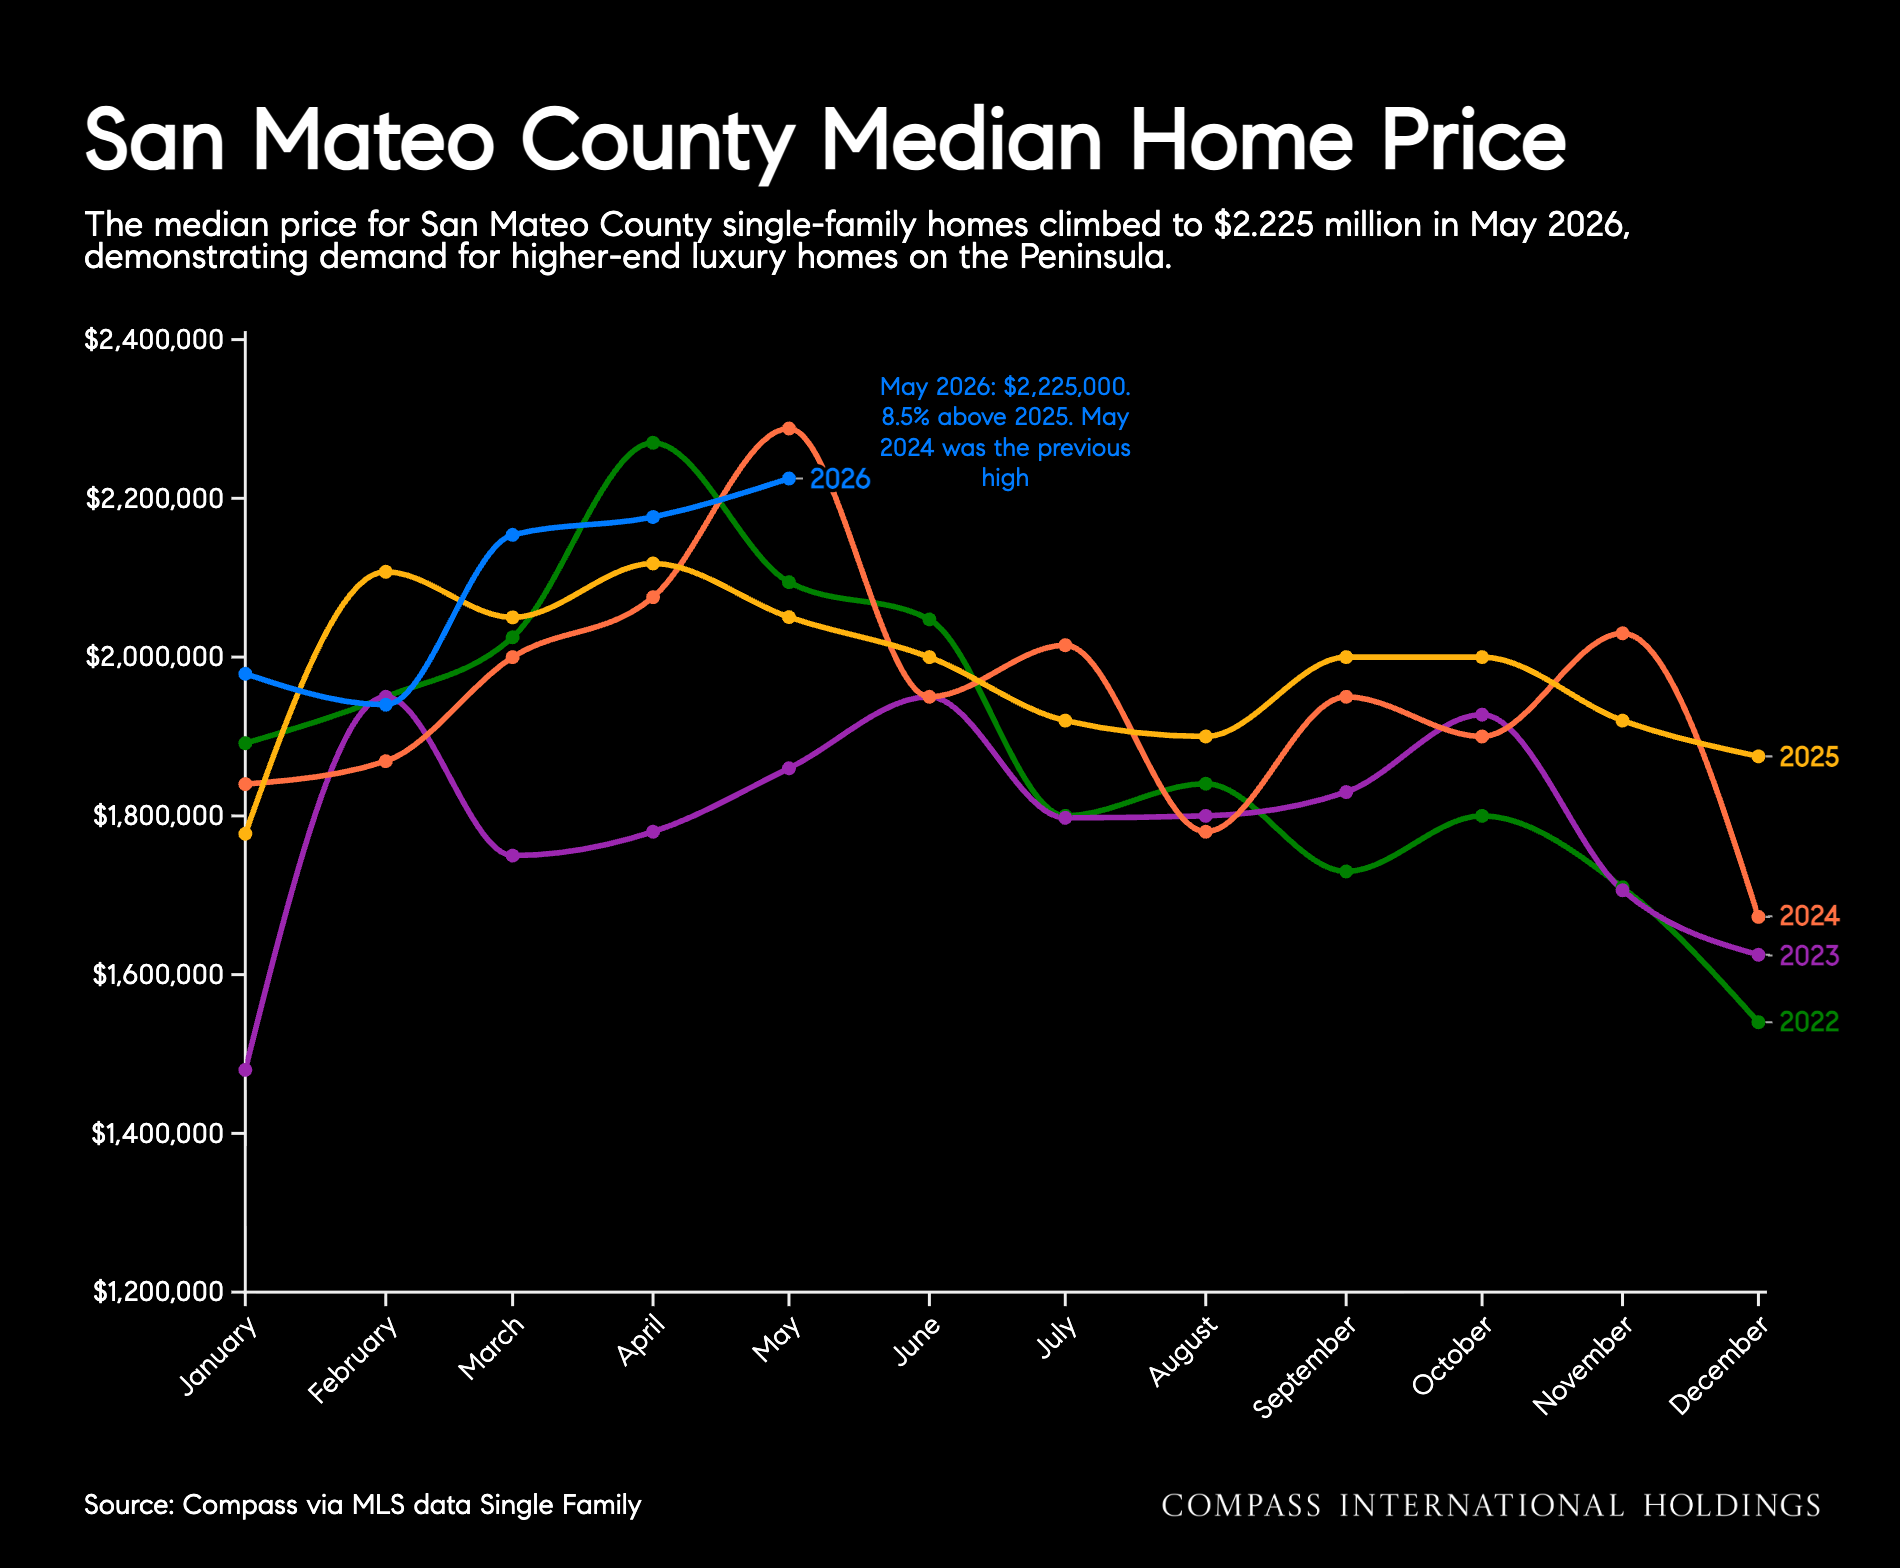
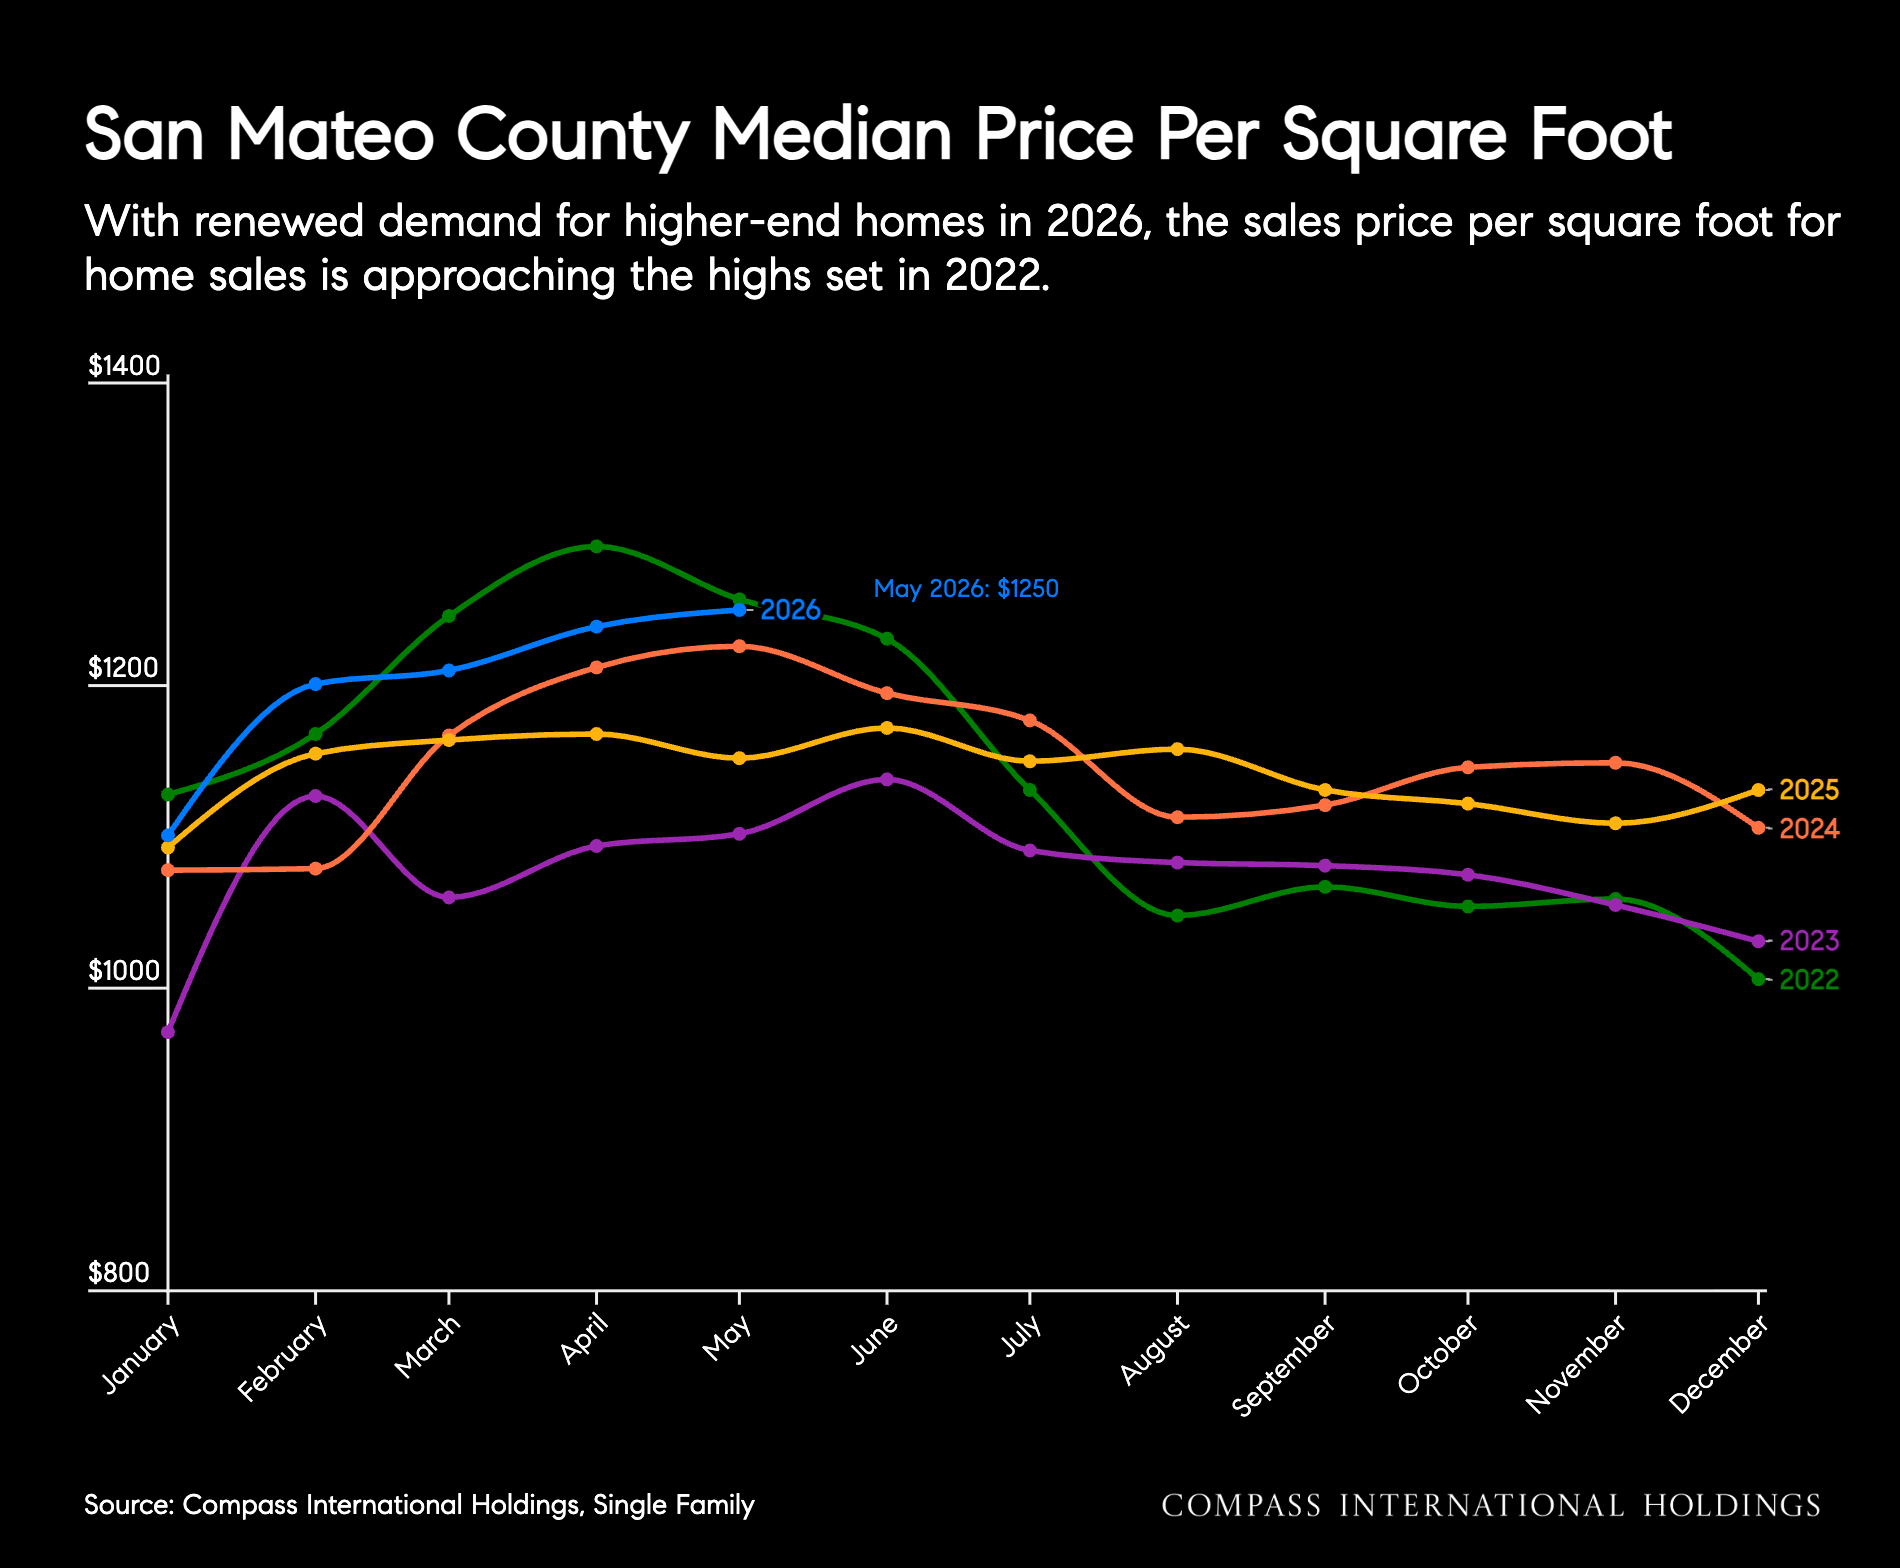
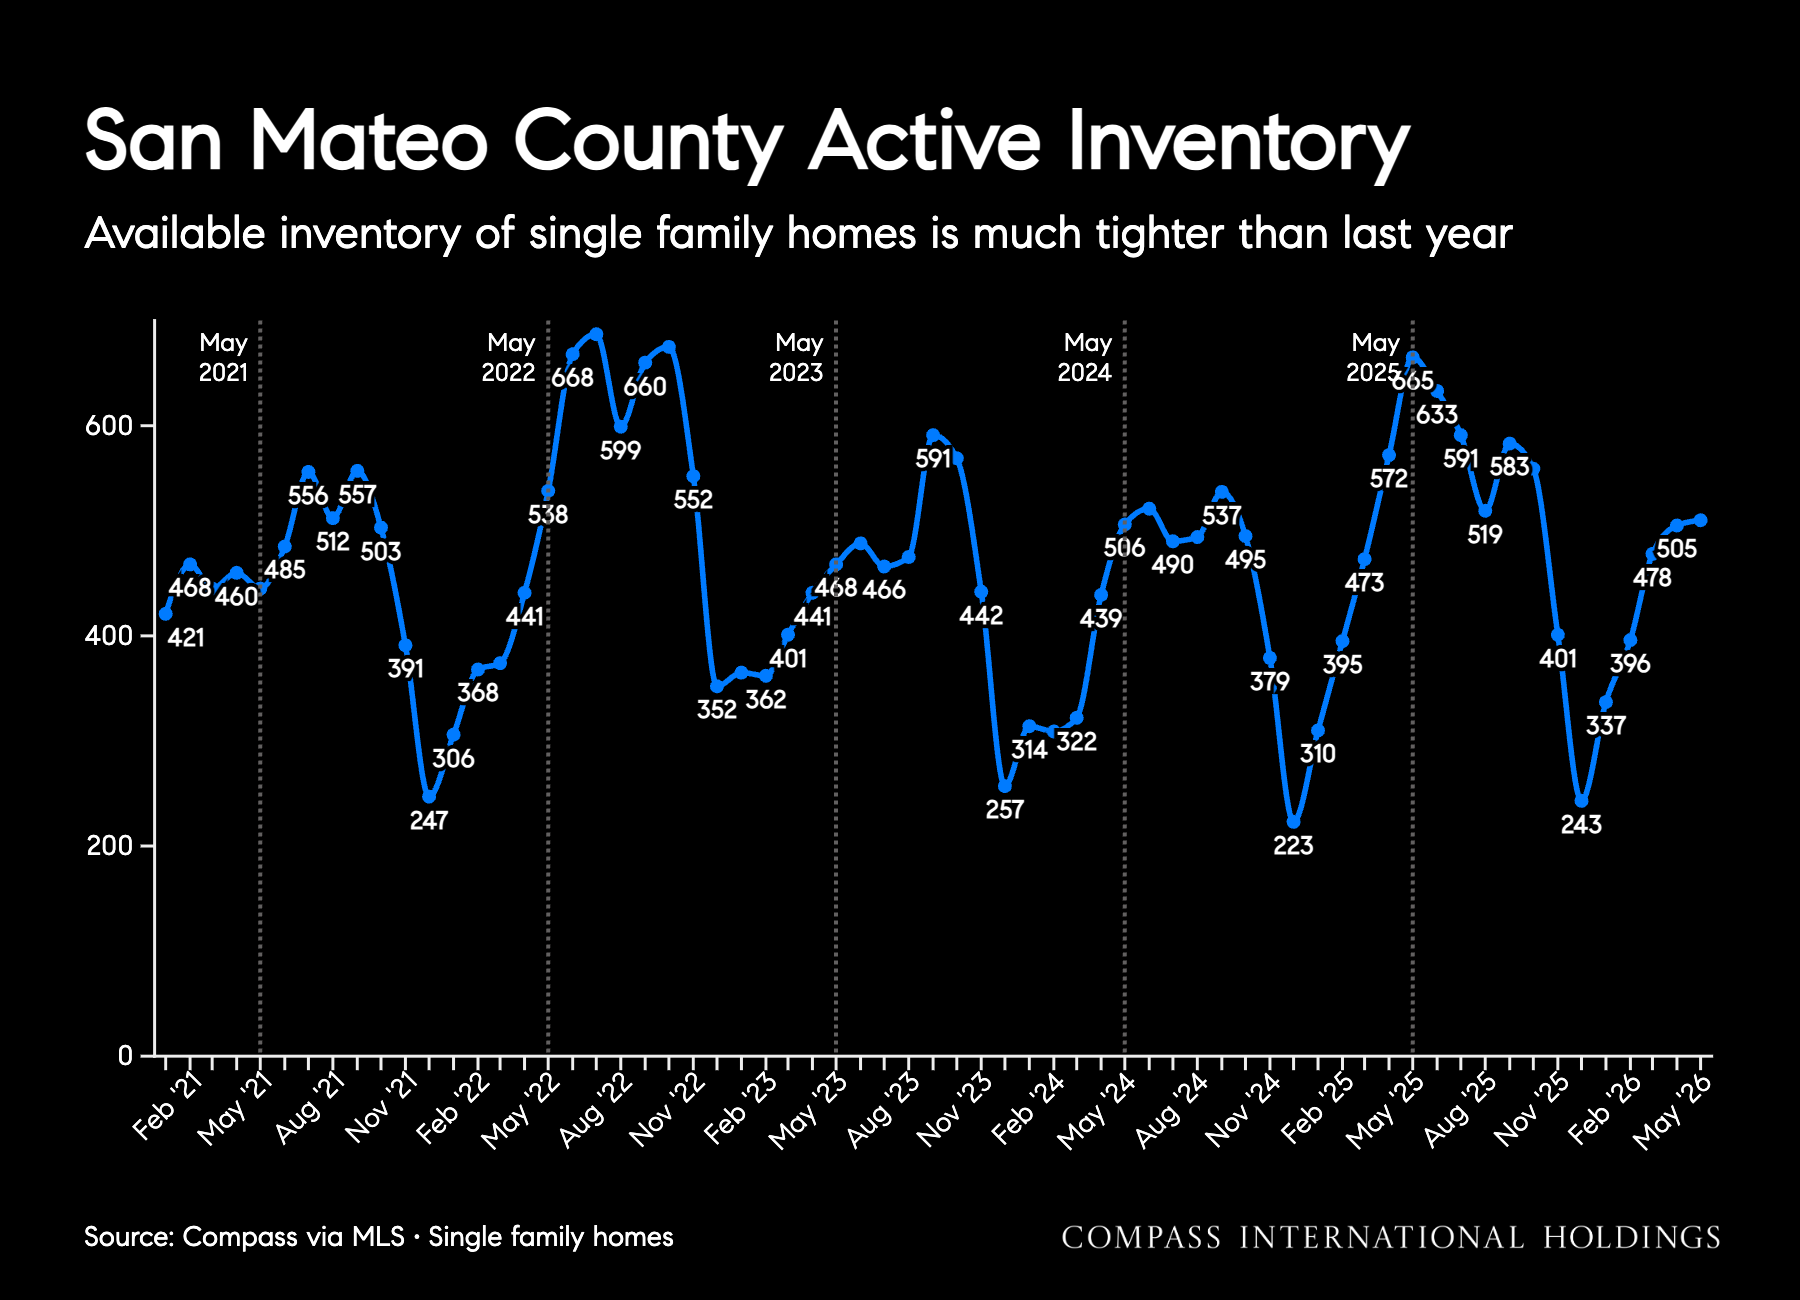
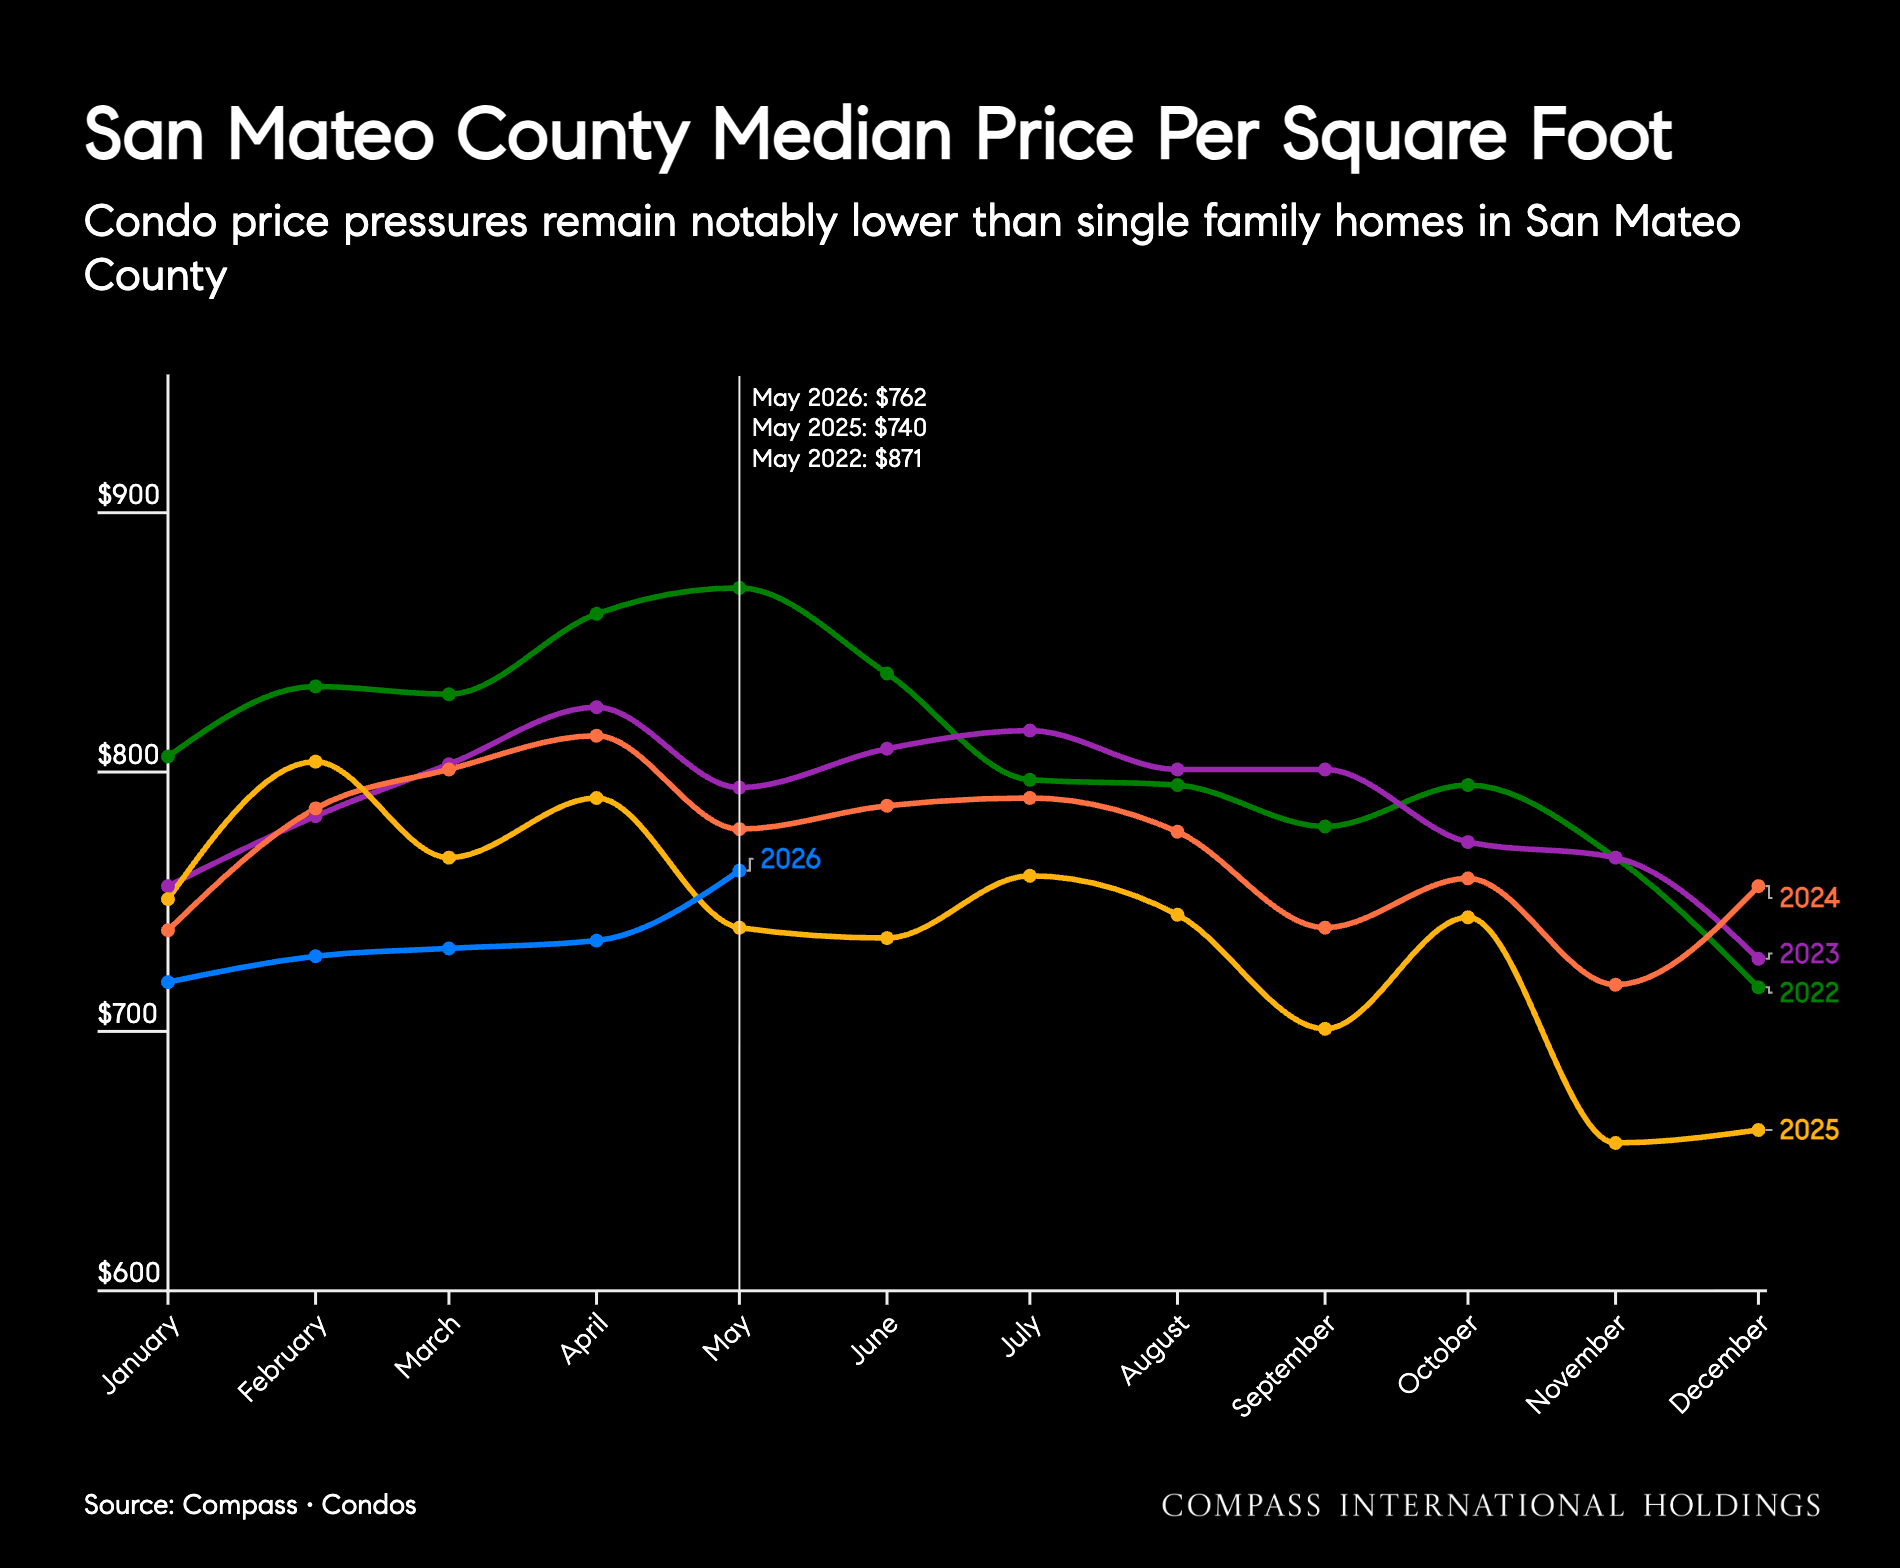
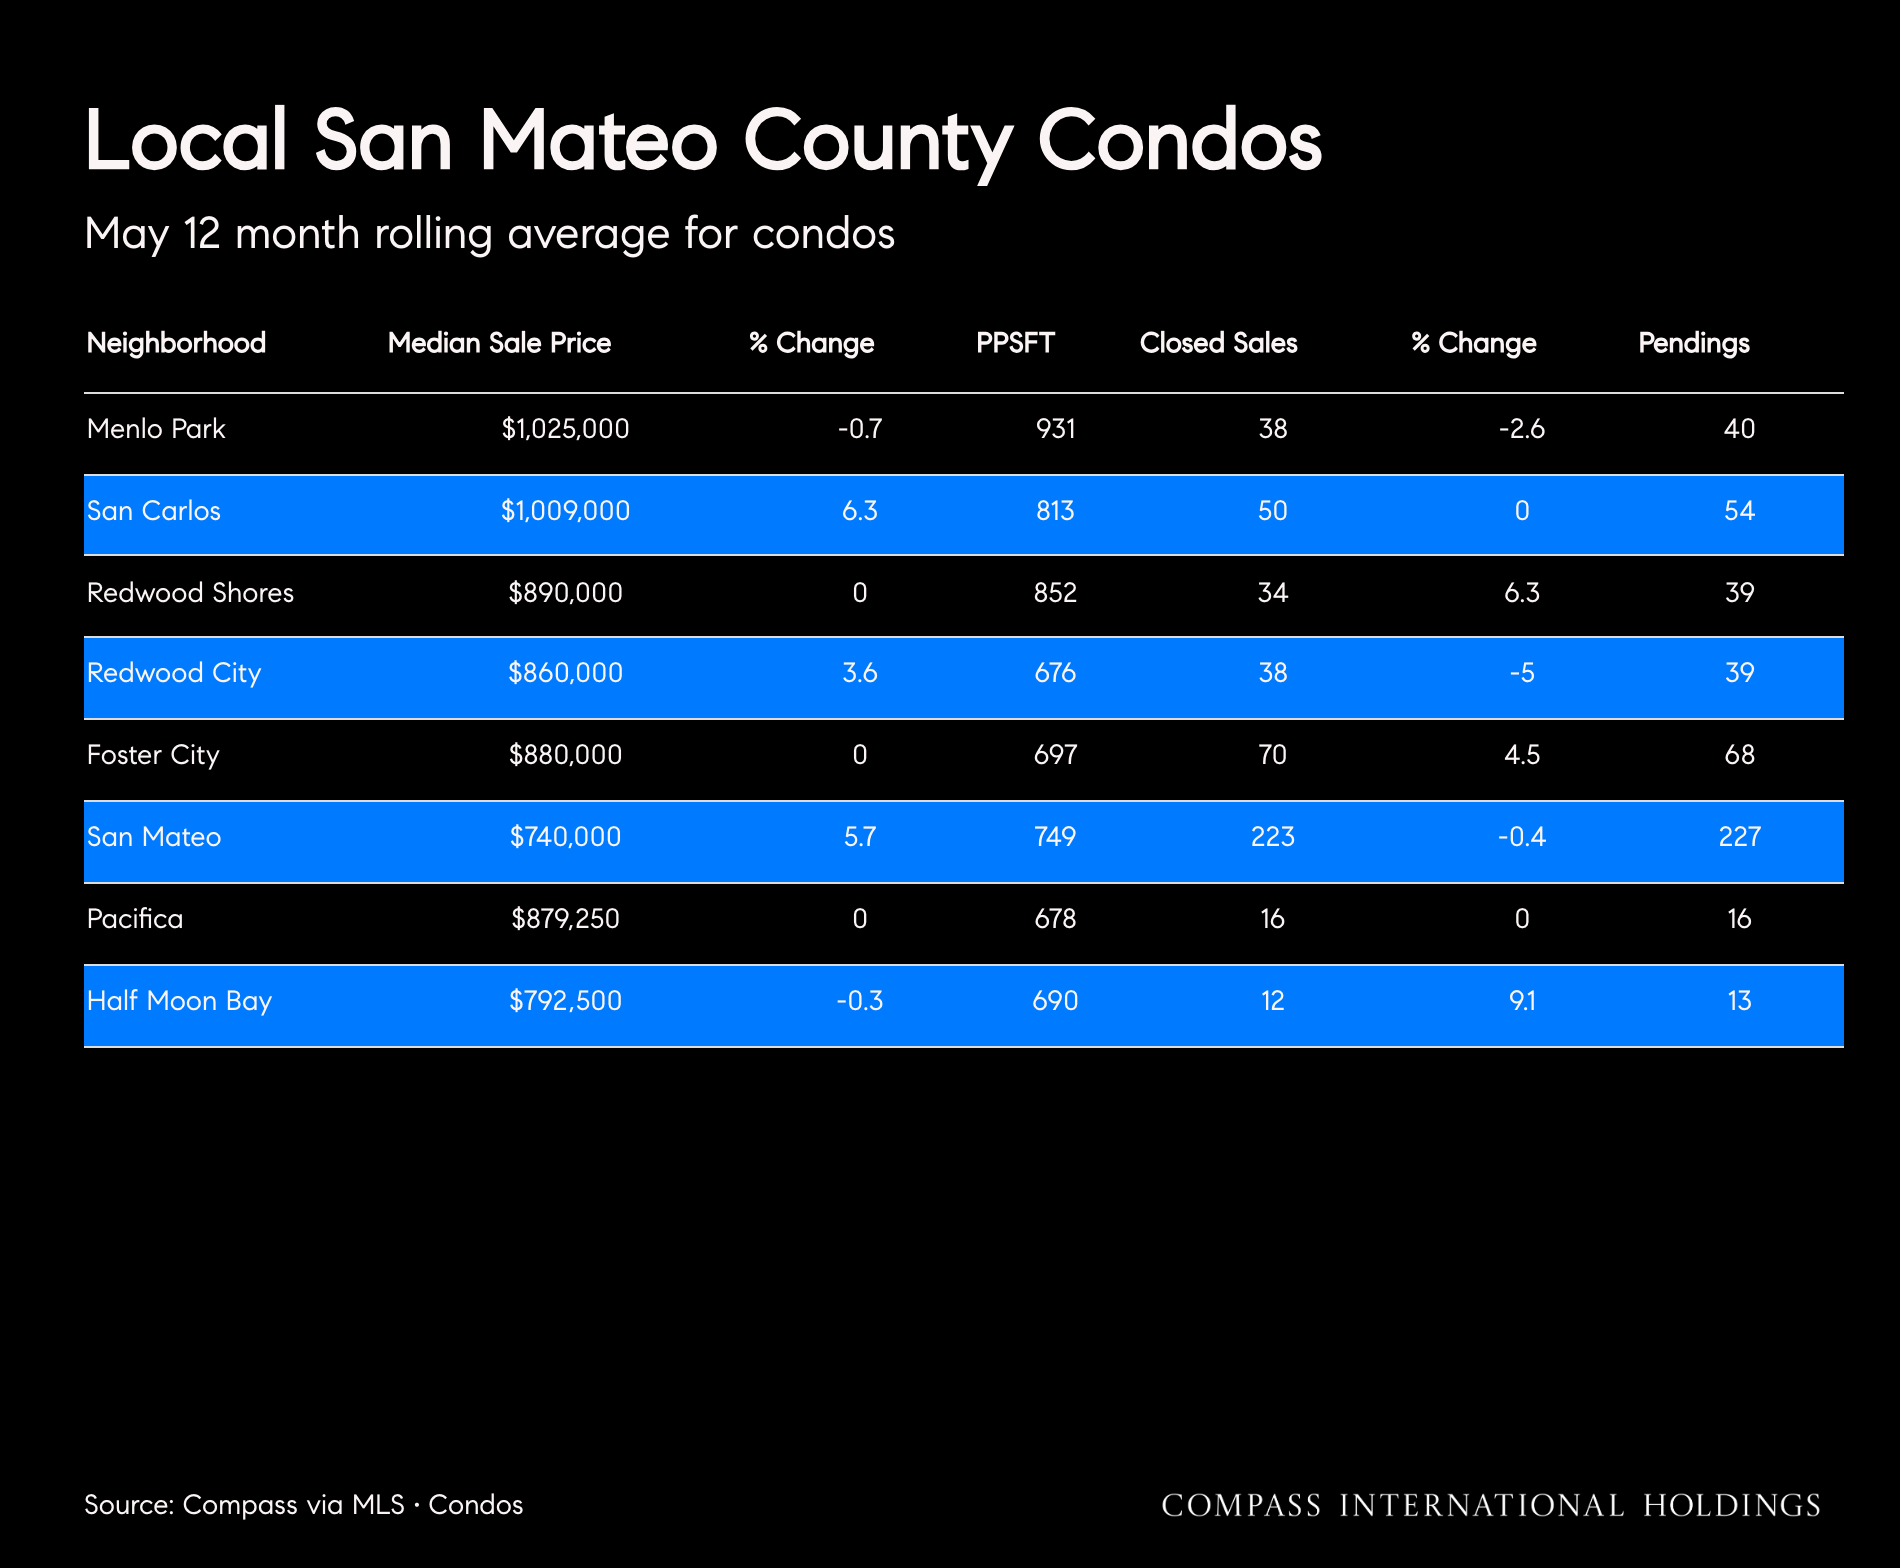
Map of Bay Area home price changes, with county regions color-coded and labeled with percentage changes. Chart of home price changes across ten Bay Area counties, with San Mateo highlighted in purple. San Mateo County median home price chart: May 2026 reached $2.225 million, 8.5% above May 2025. San Mateo County home price trends and monthly closed sales chart from 2021 to May 2026. Line chart comparing San Mateo County median price per square foot by month and year, with May 2026 at $1,250. San Mateo price-per-square-foot chart with purple monthly bars, a blue trend line, and a May 2025 marker. San Mateo County chart comparing active inventory and pending home sales from May 2024 to May 2026. San Mateo County active home inventory chart, with monthly counts from 2021 to 2026 and a blue trend line. San Mateo housing market chart shows price reductions and sales-to-list-price ratios from May 2024 to May 2026. San Mateo County single-family home days-on-market chart comparing monthly trends from 2022 to 2026. San Mateo County single-family home market table with neighborhood prices, sales, percentage changes, and pending sales. San Mateo County single-family home market table with neighborhood prices, sales, and pending listings. Line chart of San Mateo County median condo prices by month and year, with May 2026 at $845,000. San Mateo County condo price-per-square-foot chart comparing monthly trends from 2022 through May 2026. San Mateo condo price-per-square-foot chart, with monthly price line and median square-footage bars. San Mateo County condo inventory and pending sales chart, with May 2025 highlighted. Line chart of San Mateo County active condo inventory, peaking at 285 in May 2025 and ending at 256 in May 2026. San Mateo County days-on-market chart comparing monthly figures for 2022–2026, with May values highlighted. San Mateo County condo market table with prices, price changes, closed sales, and pending listings by neighborhood. San Mateo County townhouse market table with May prices, price changes, closed sales, and pending listings by city. San Mateo, CA location graphic with coordinates
Lori Buecheler

Lori Buecheler

DRE# 01859485

M: 650.387.2716

O: 650.323.1111

[email protected]

Compass is a real estate broker licensed by the State of California operating under multiple entities. License Numbers 01991628, 01527235, 01527365. All material is intended for informational purposes only and is compiled from sources deemed reliable but is subject to errors, omissions, changes in price, condition, sale, or withdrawal without notice. No statement is made as to the accuracy of any description or measurements including square footage. This is not intended to solicit property already listed. No financial or legal advice provided. Equal Housing Opportunity. Photos may be virtually staged or digitally enhanced and may not reflect actual property conditions.

Work With Lori

With over 30 years in sales, marketing, and client service, my clients describe me as "the Realtor who goes above and beyond” when it comes to market knowledge, integrity, service level and results.
Let's Connect
Follow Us on Instagram